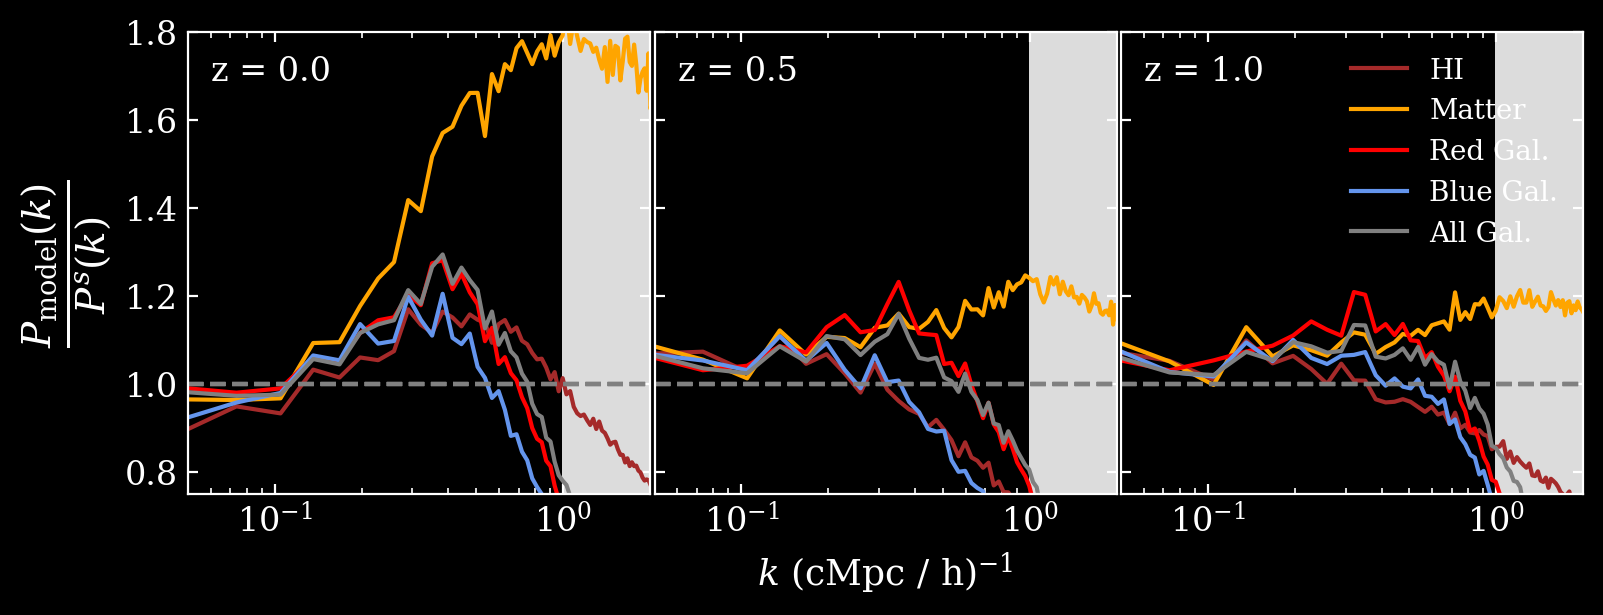
§4.3: RSD Errors at all redshifts
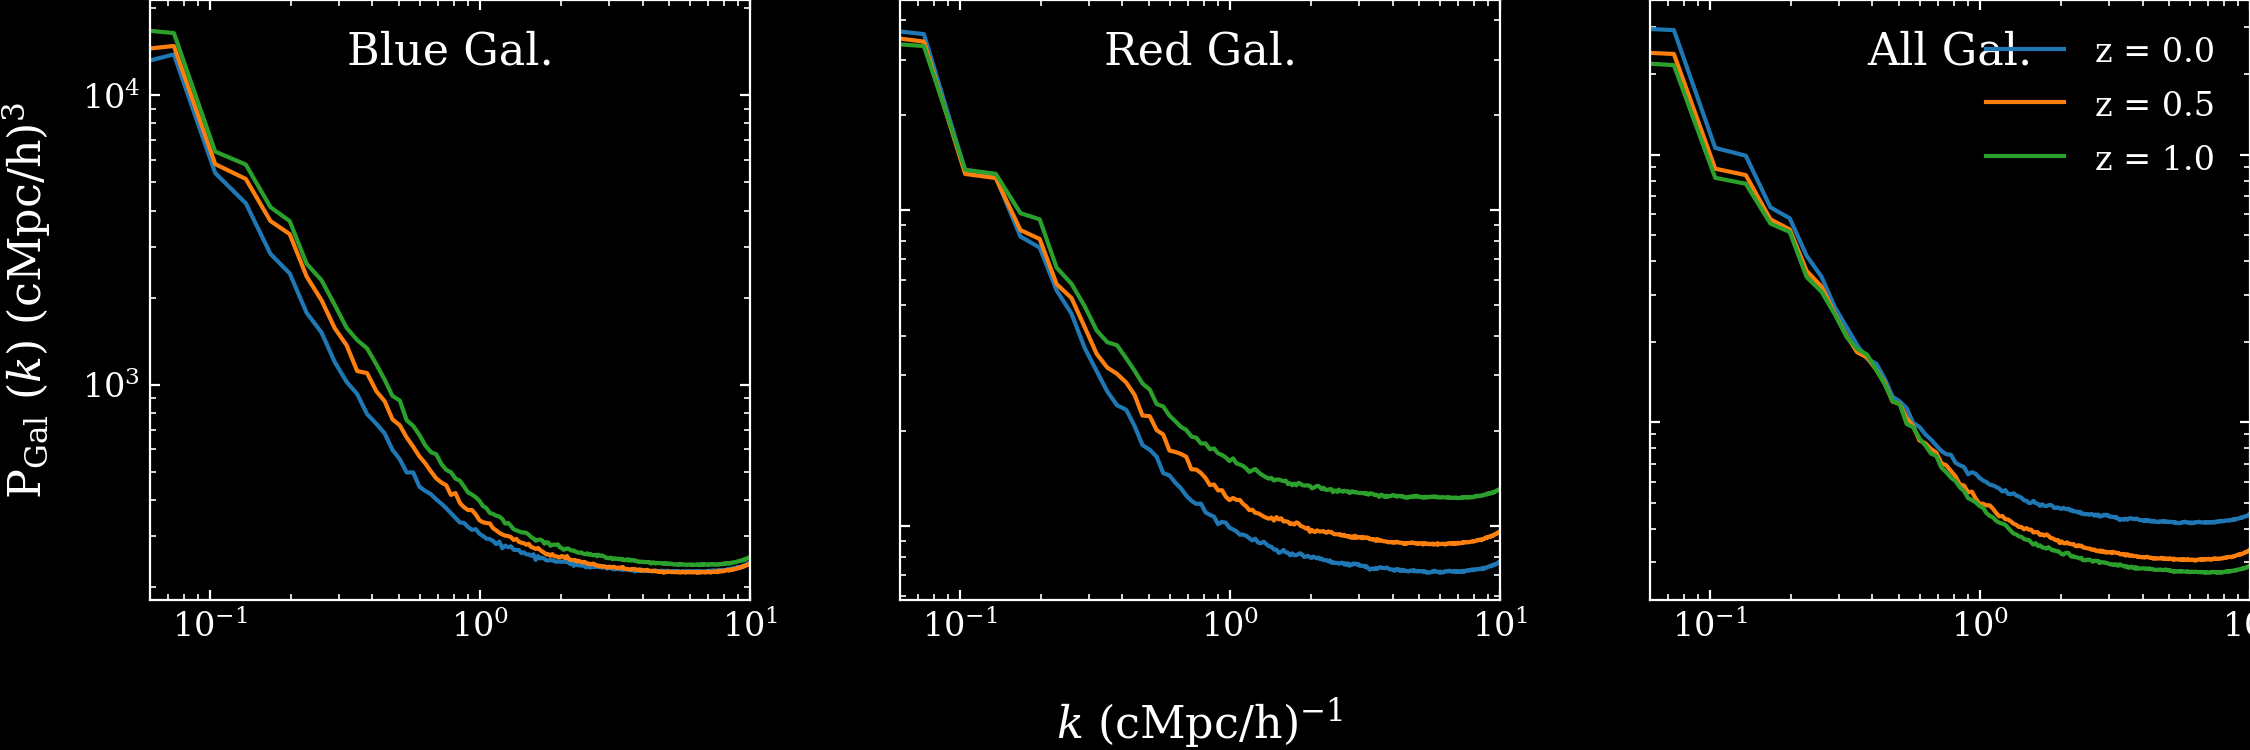
§4.3: Redshift-Space Galaxy Auto Power Spectra
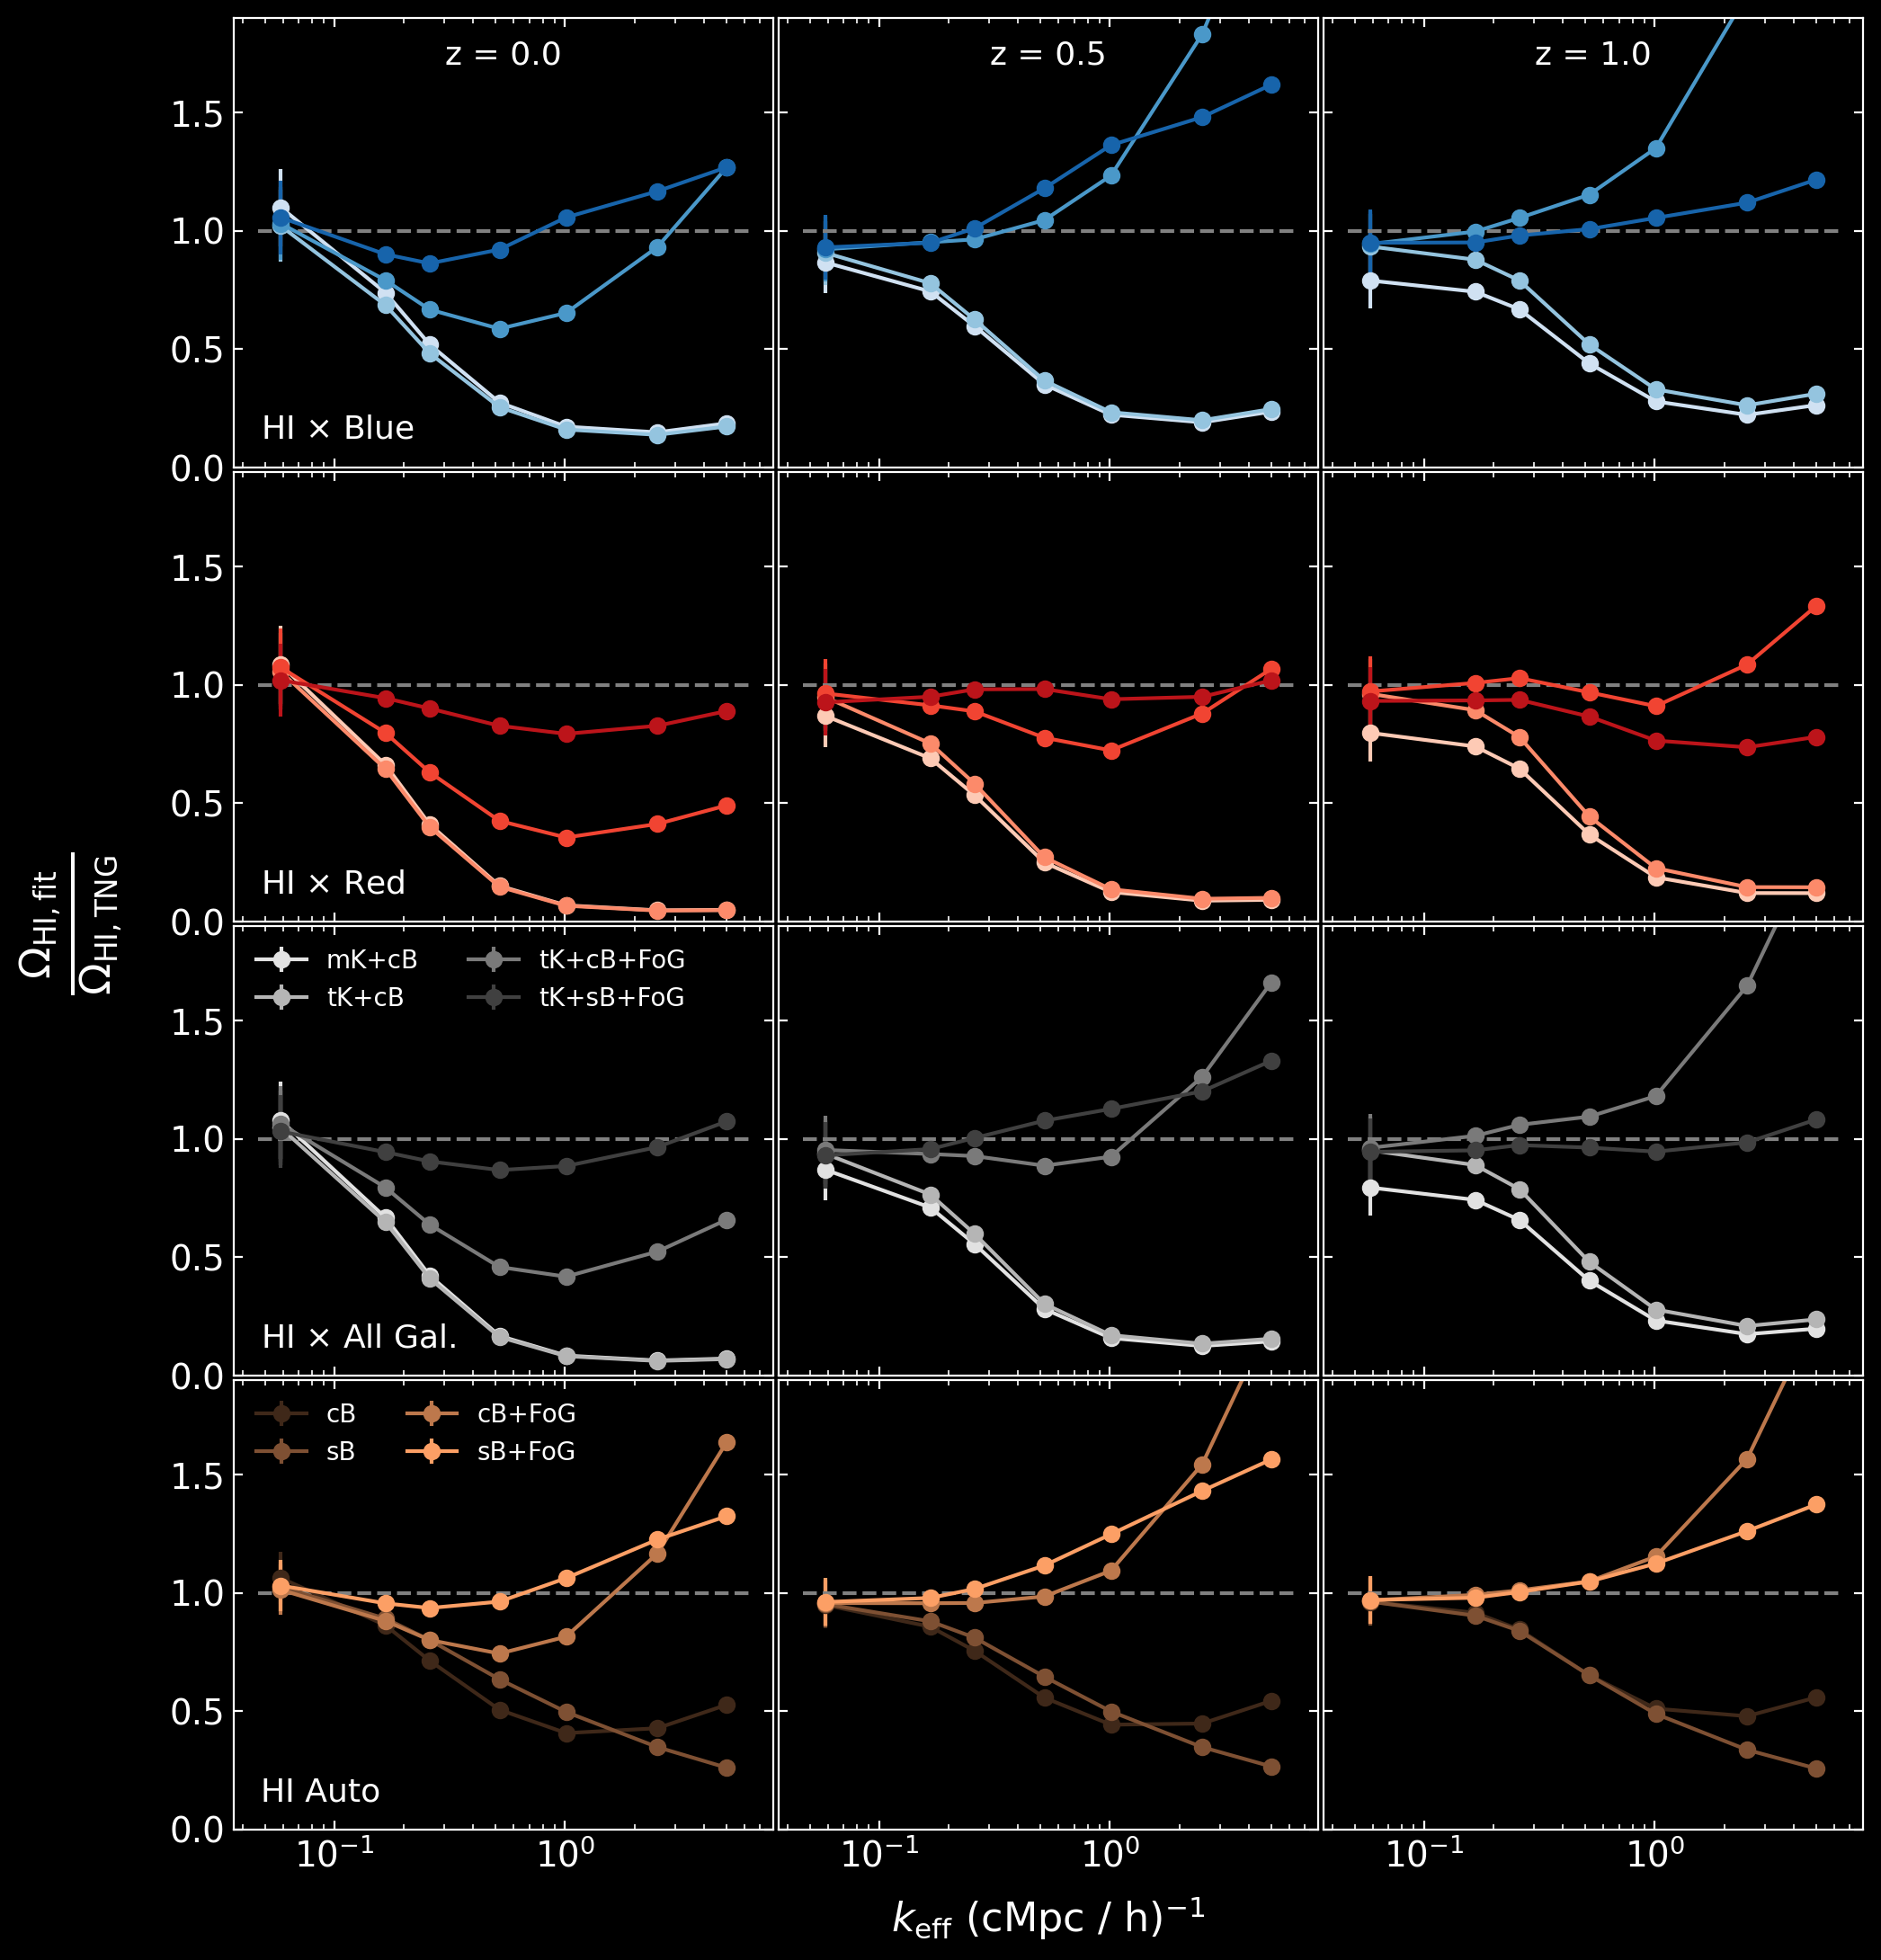
§5.3.1: Ω with Error Bars
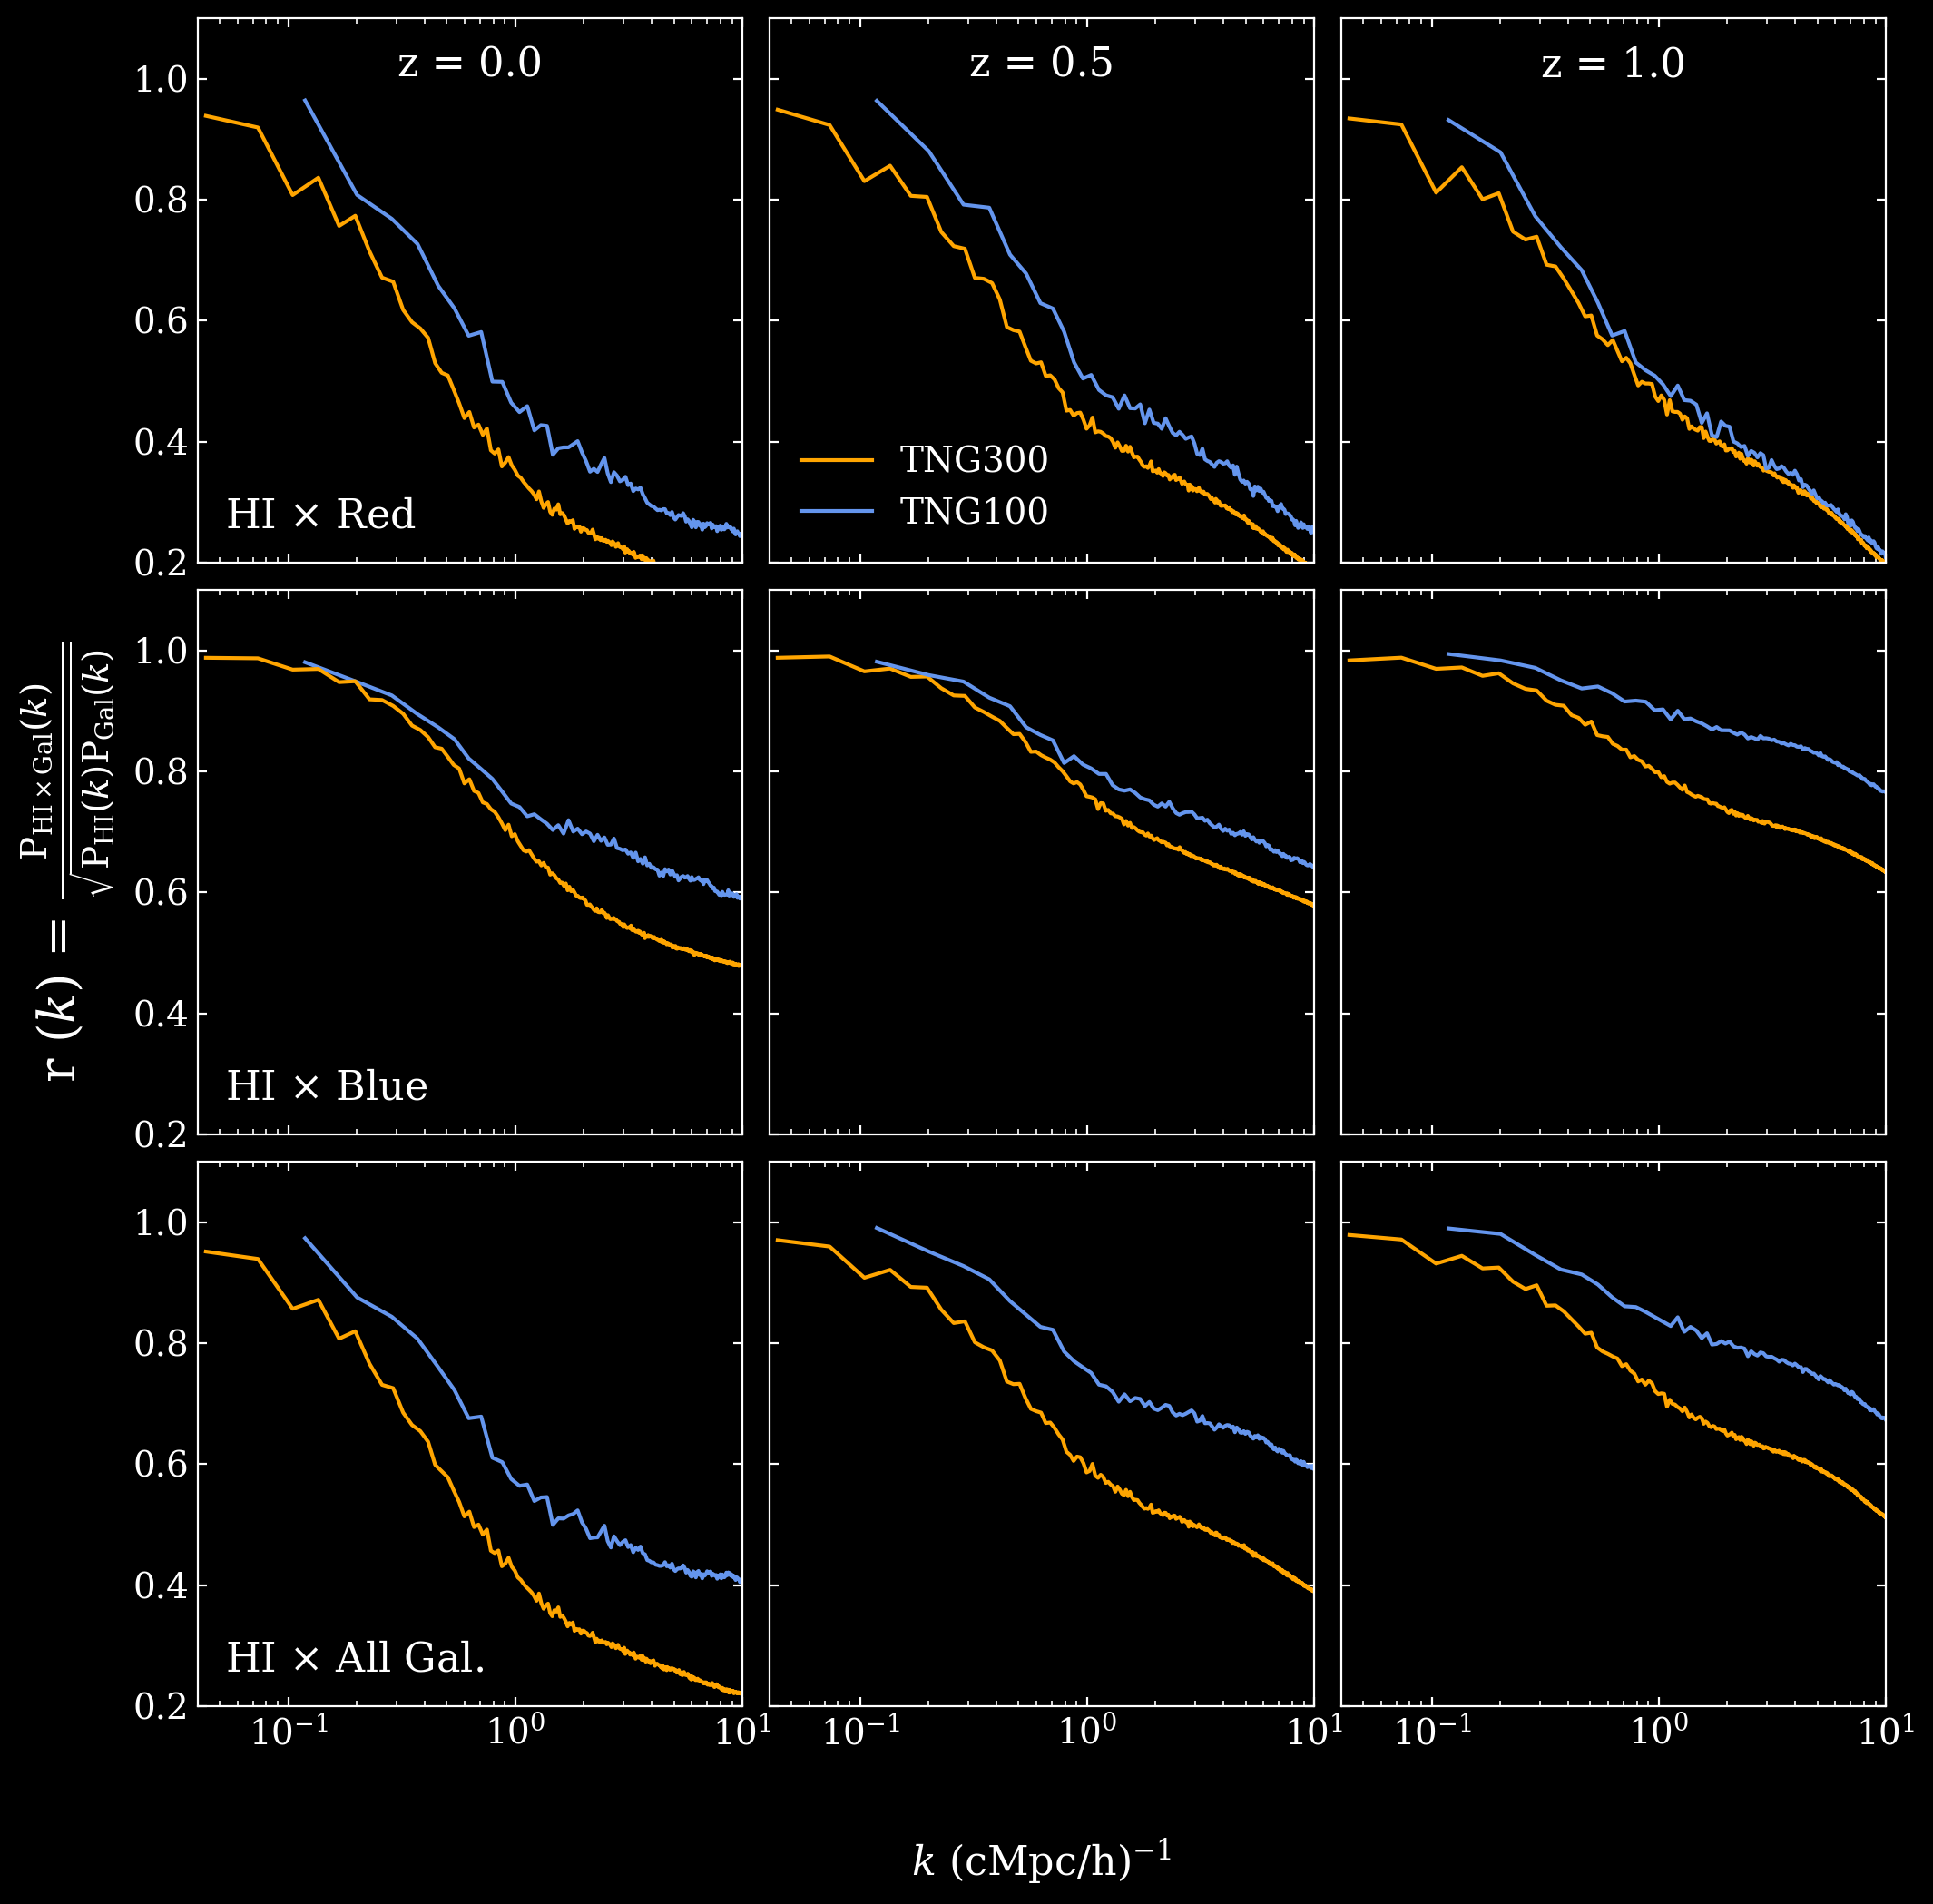
§A: Resolution Dependence of Correlation Coefficients
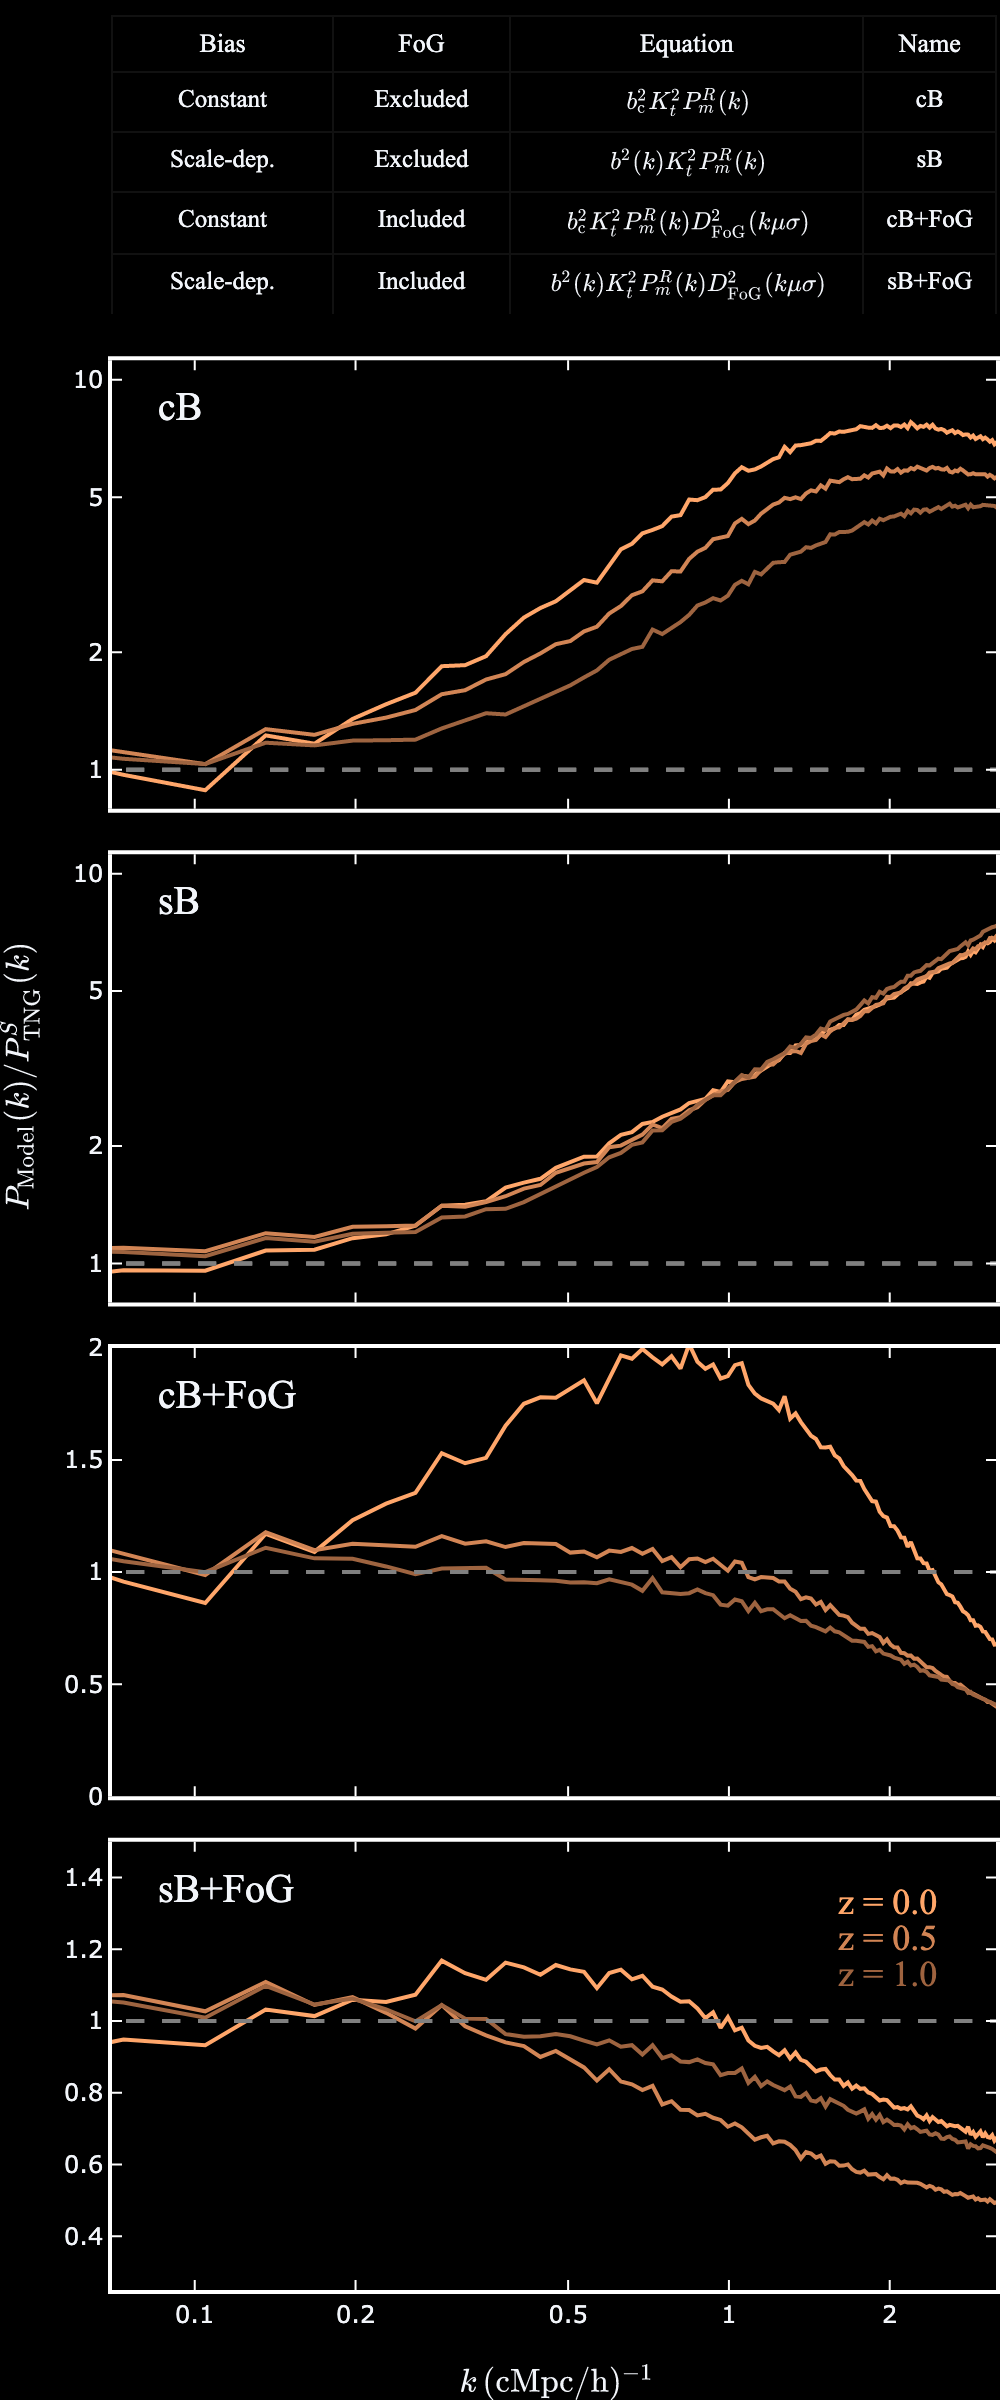
§C: the redshift evolution of HI auto model errors
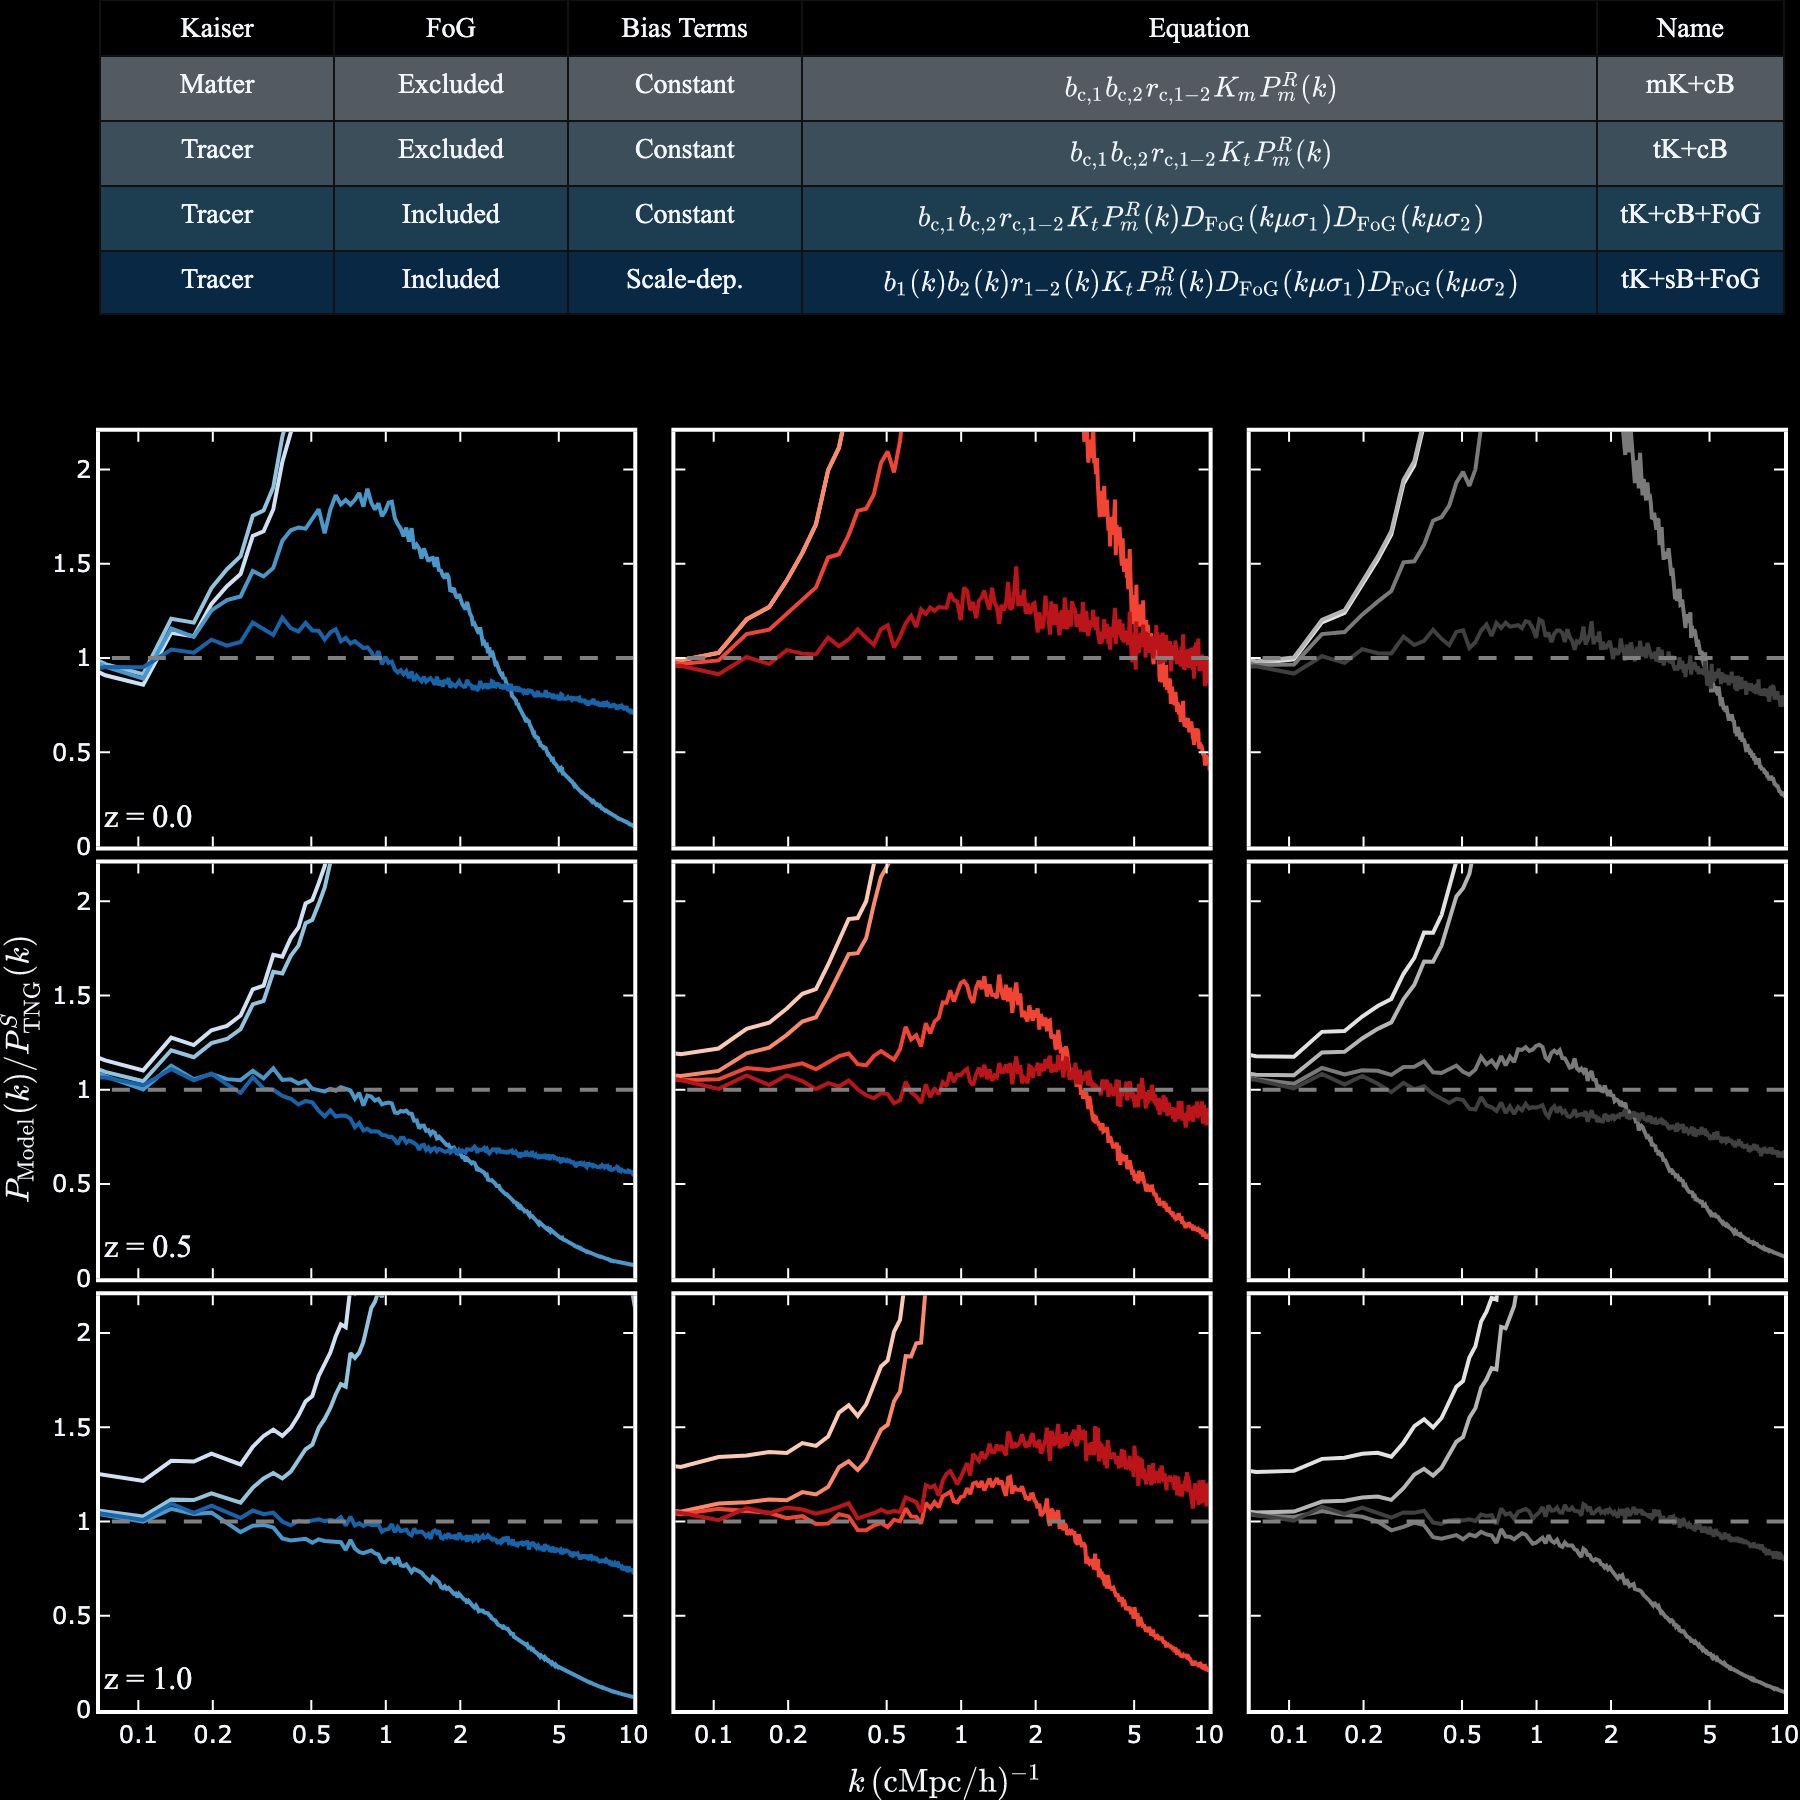
§C: HI-Galaxy Models at all redshifts
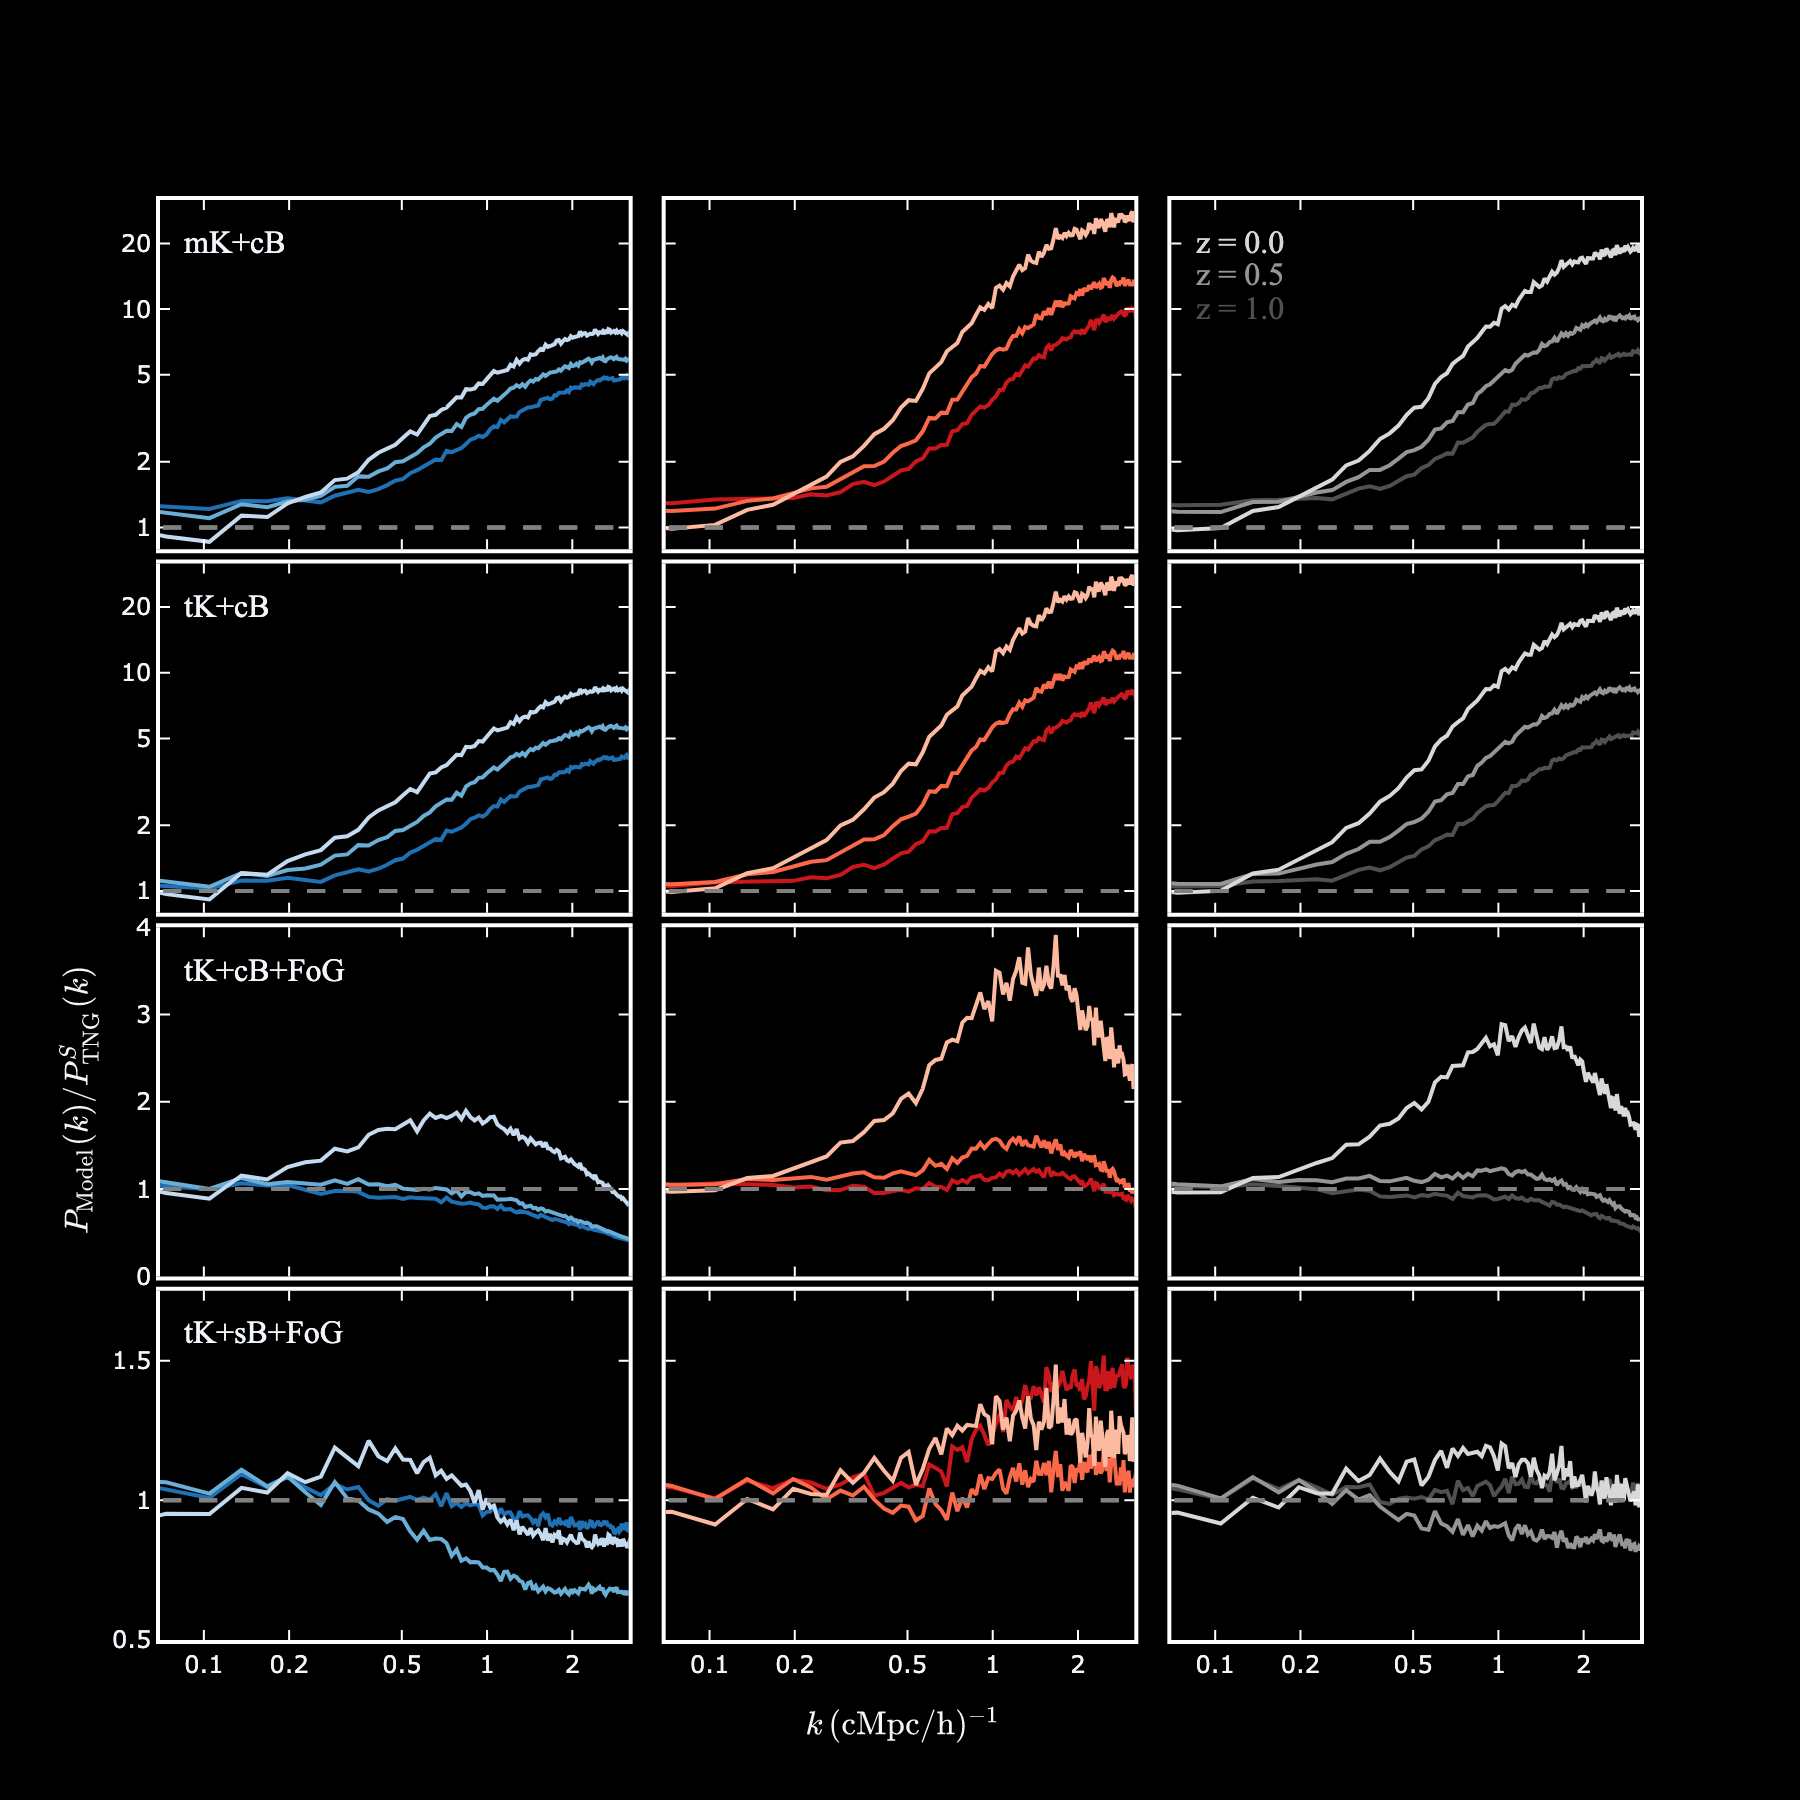
§C: The redshift evolution of HI-Galaxy models
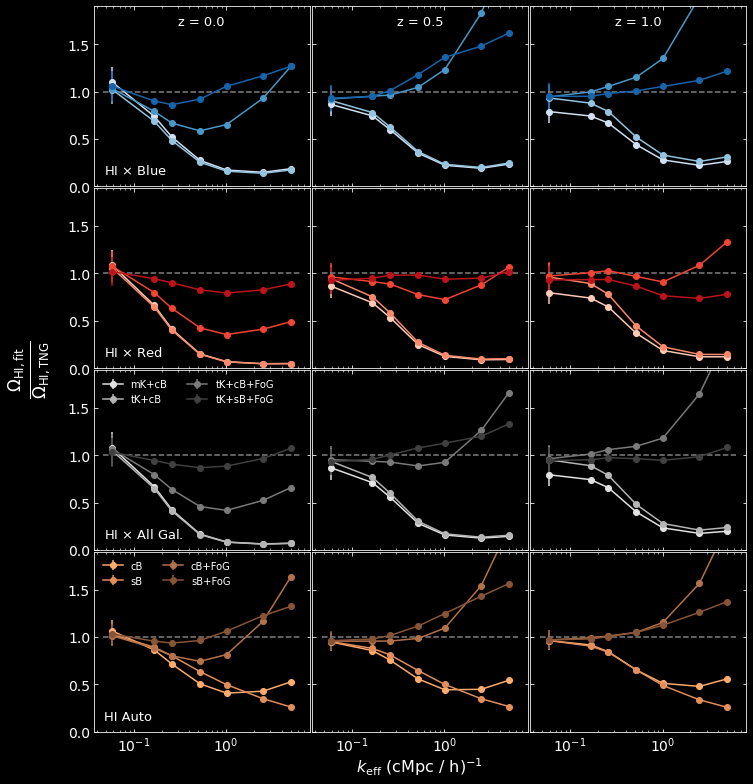
§C: actual vs inferred Omega, all redshifts
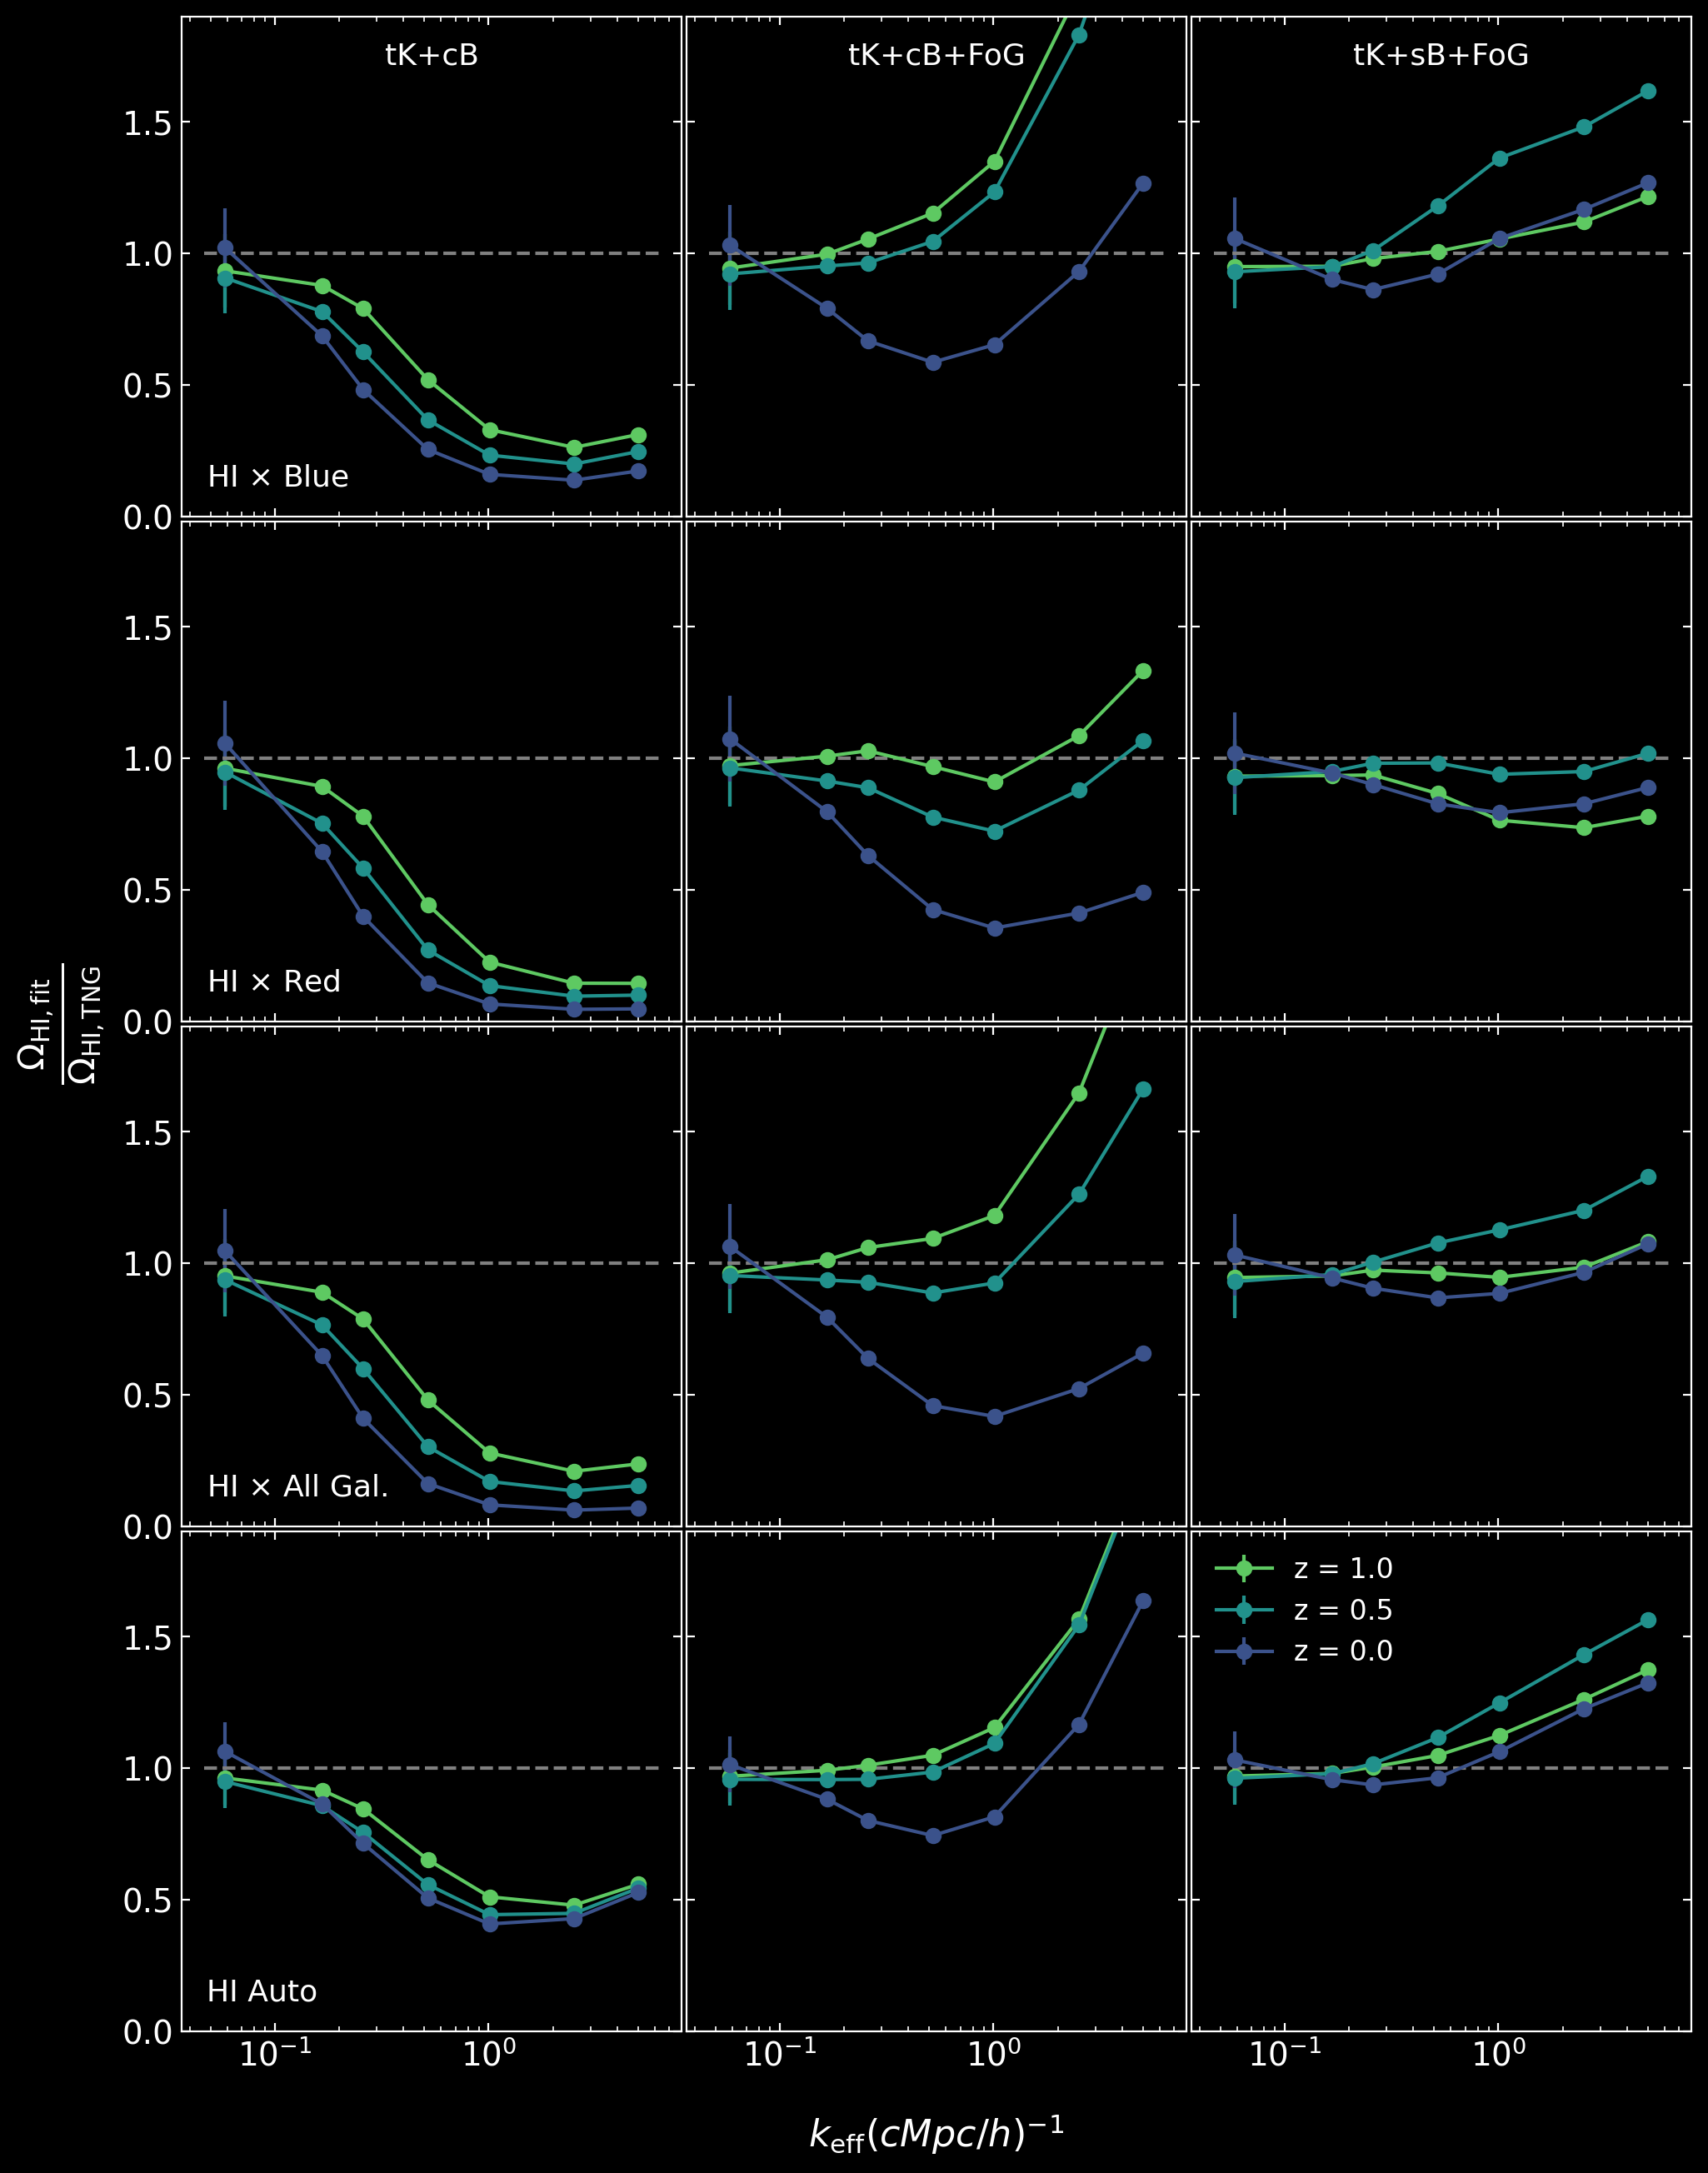
§C: Accuracy of inferred Omega values for each model with redshift

§D: Comparing errors between auto and cross-powers
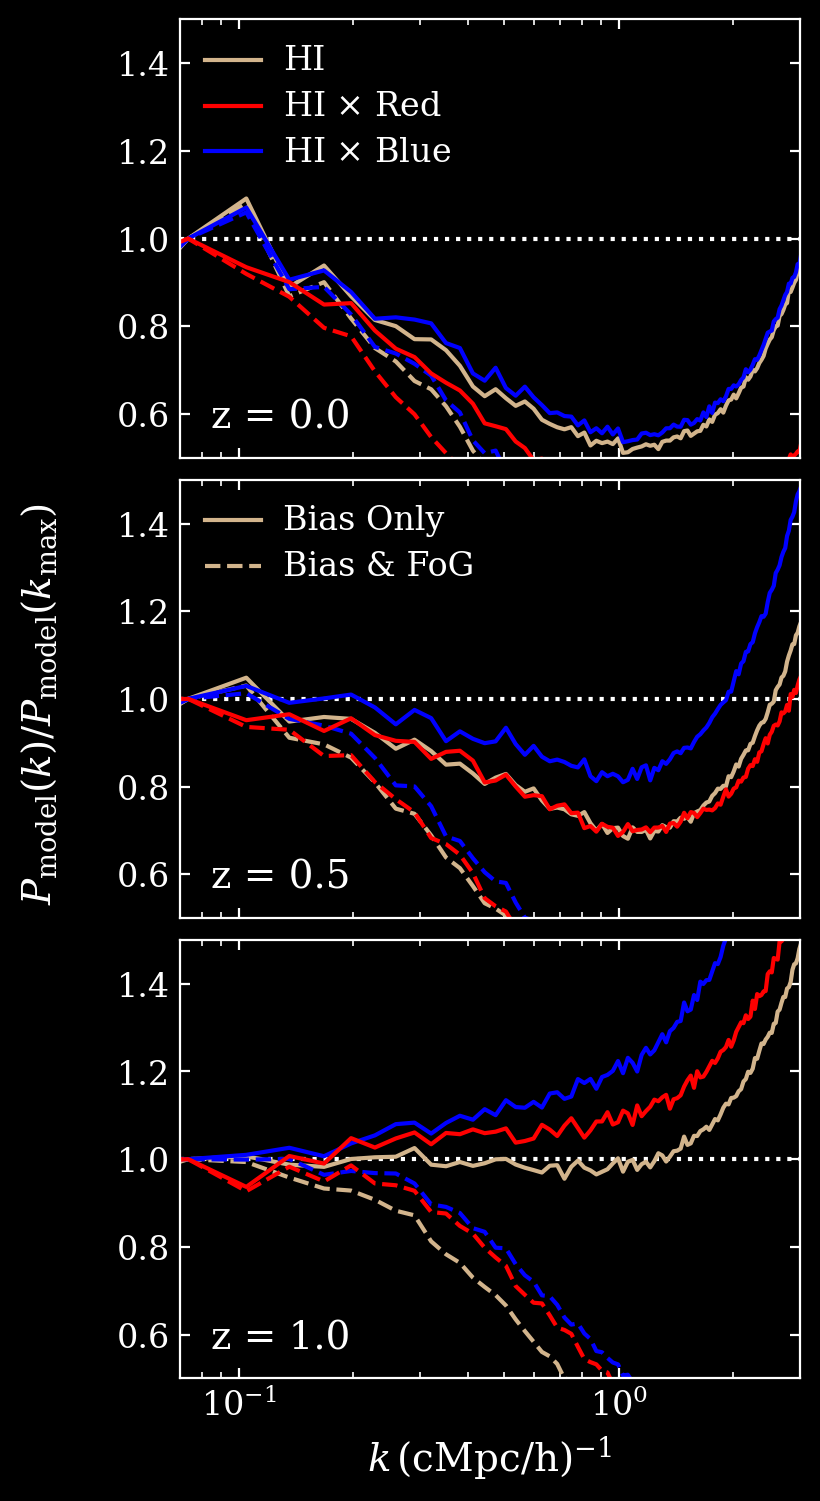
§D: comparing the validity of constant-bias assumptions


