cosmic cartography
F. Vazza, D. Wittor, J. West
In the 1920s, Edwin Hubble famously observed that the Universe was expanding.
Soon after, physicists attributed the expansion to the remnants of
the Big Bang. Over a long enough period of time, they speculated that
the expansion would be slowed by gravity. This was a sensible conclusion,
as gravity was the only known force that operated over such long distances.
In the 1990s, however, we discovered that the Universe's expansion was
accelerating, not slowing down.
Our current
Standard Model
of physics does not possess any forces that could drive the
accelerating expansion; this indicates that our
understanding of physics is fundamentally incomplete.
The mysterious force that is driving the accelerating expansion is
called "dark energy". Uncovering the nature of dark energy is a
critical step to a deeper understanding of the physical laws that
govern our Universe.
The first step to solving dark energy is to precisely measure
the expansion rate across the Universe's history. Recording
dark energy's behavior establishes a foundation for future theories
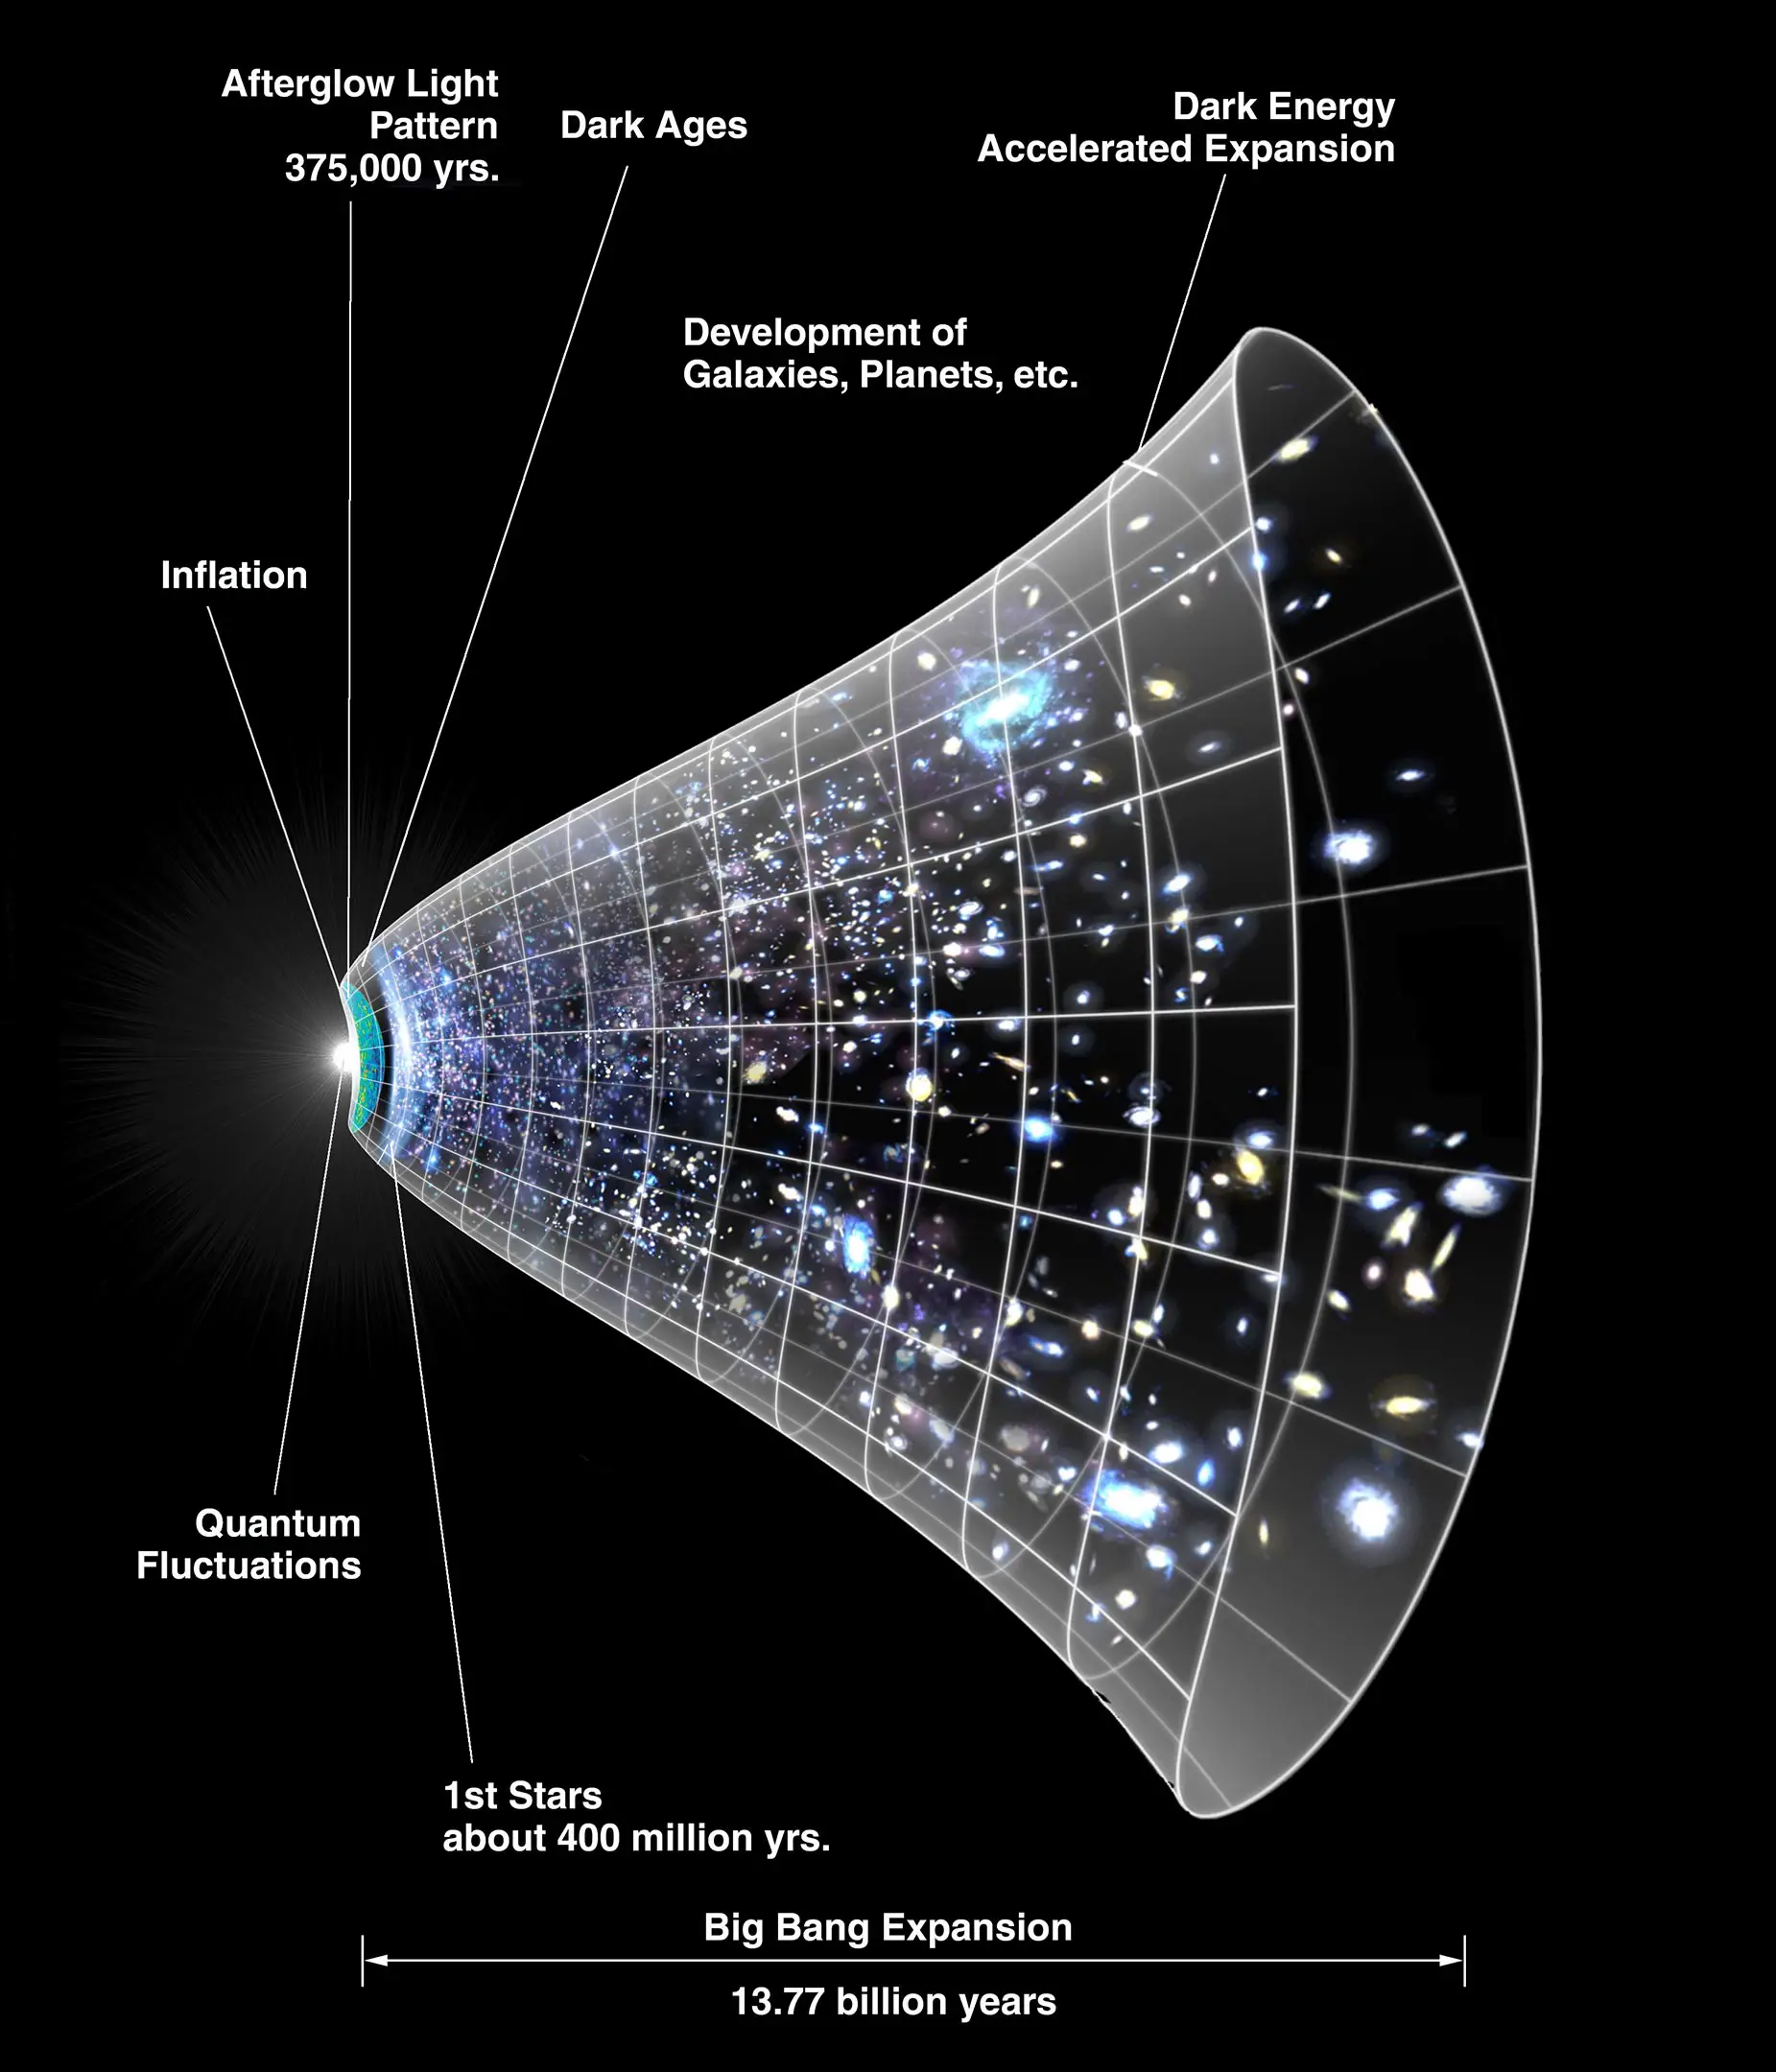
to decipher the mechanism behind it. The current timeline of
the Universe's history is shown on the left.
Image Credits: NASA/WMAP Science Team; Dana Berry
Now that we understand the motivation for measuring the Universe's expansion
rate, how do we measure it? There are a few different ways, but fortunately the Universe
provided a ruler for us to use.
How this ruler comes about is a fair bit
complicated, but the video above from CAASTRO provides a very useful visualization of this
process.
The early Universe consisted of a fluid
mixture of light and matter, which were coupled
together because of the Universe's extremely
high density or compactness. "Coupled" in this case
indicates that the physical properties (in particular,
the temperature and pressure) of light and matter
were linked by their constant interactions.
Any changes in one would also
occur in the other. During an event called
"inflation",
quantum fluctuations perturb the light-matter fluid, forming ripples,
almost as if someone dropped a bunch of pebbles into
the fluid at the same time. These ripples all
travel across the fluid at a constant speed, as is
shown in the first 30 seconds of the video, forming rings
of approximately the same size.
However, the Universe's expansion eventually pulled
the light and matter apart, destroying the fluid
mixture. We still see light from this event coming from
every direction! This is called the
Cosmic Microwave Background,
which we won't go into here. The ripples freeze and create
nearly identical rings in the matter distribution.
Galaxies then form inside of these rings. By
studying the spatial distribution of galaxies statistically,
we can measure how the size of these rings change with time due to
the Universe's expansion. However, studying the entire Universe
one galaxy at a time can be quite expensive -- you can imagine trying
to measure the depth of the ocean with a bucket, it's a lot of work and
very time-intensive. Financially, it's expensive too, especially when we
spend billions of dollars to create state-of-the-art buckets that we
launch into space.
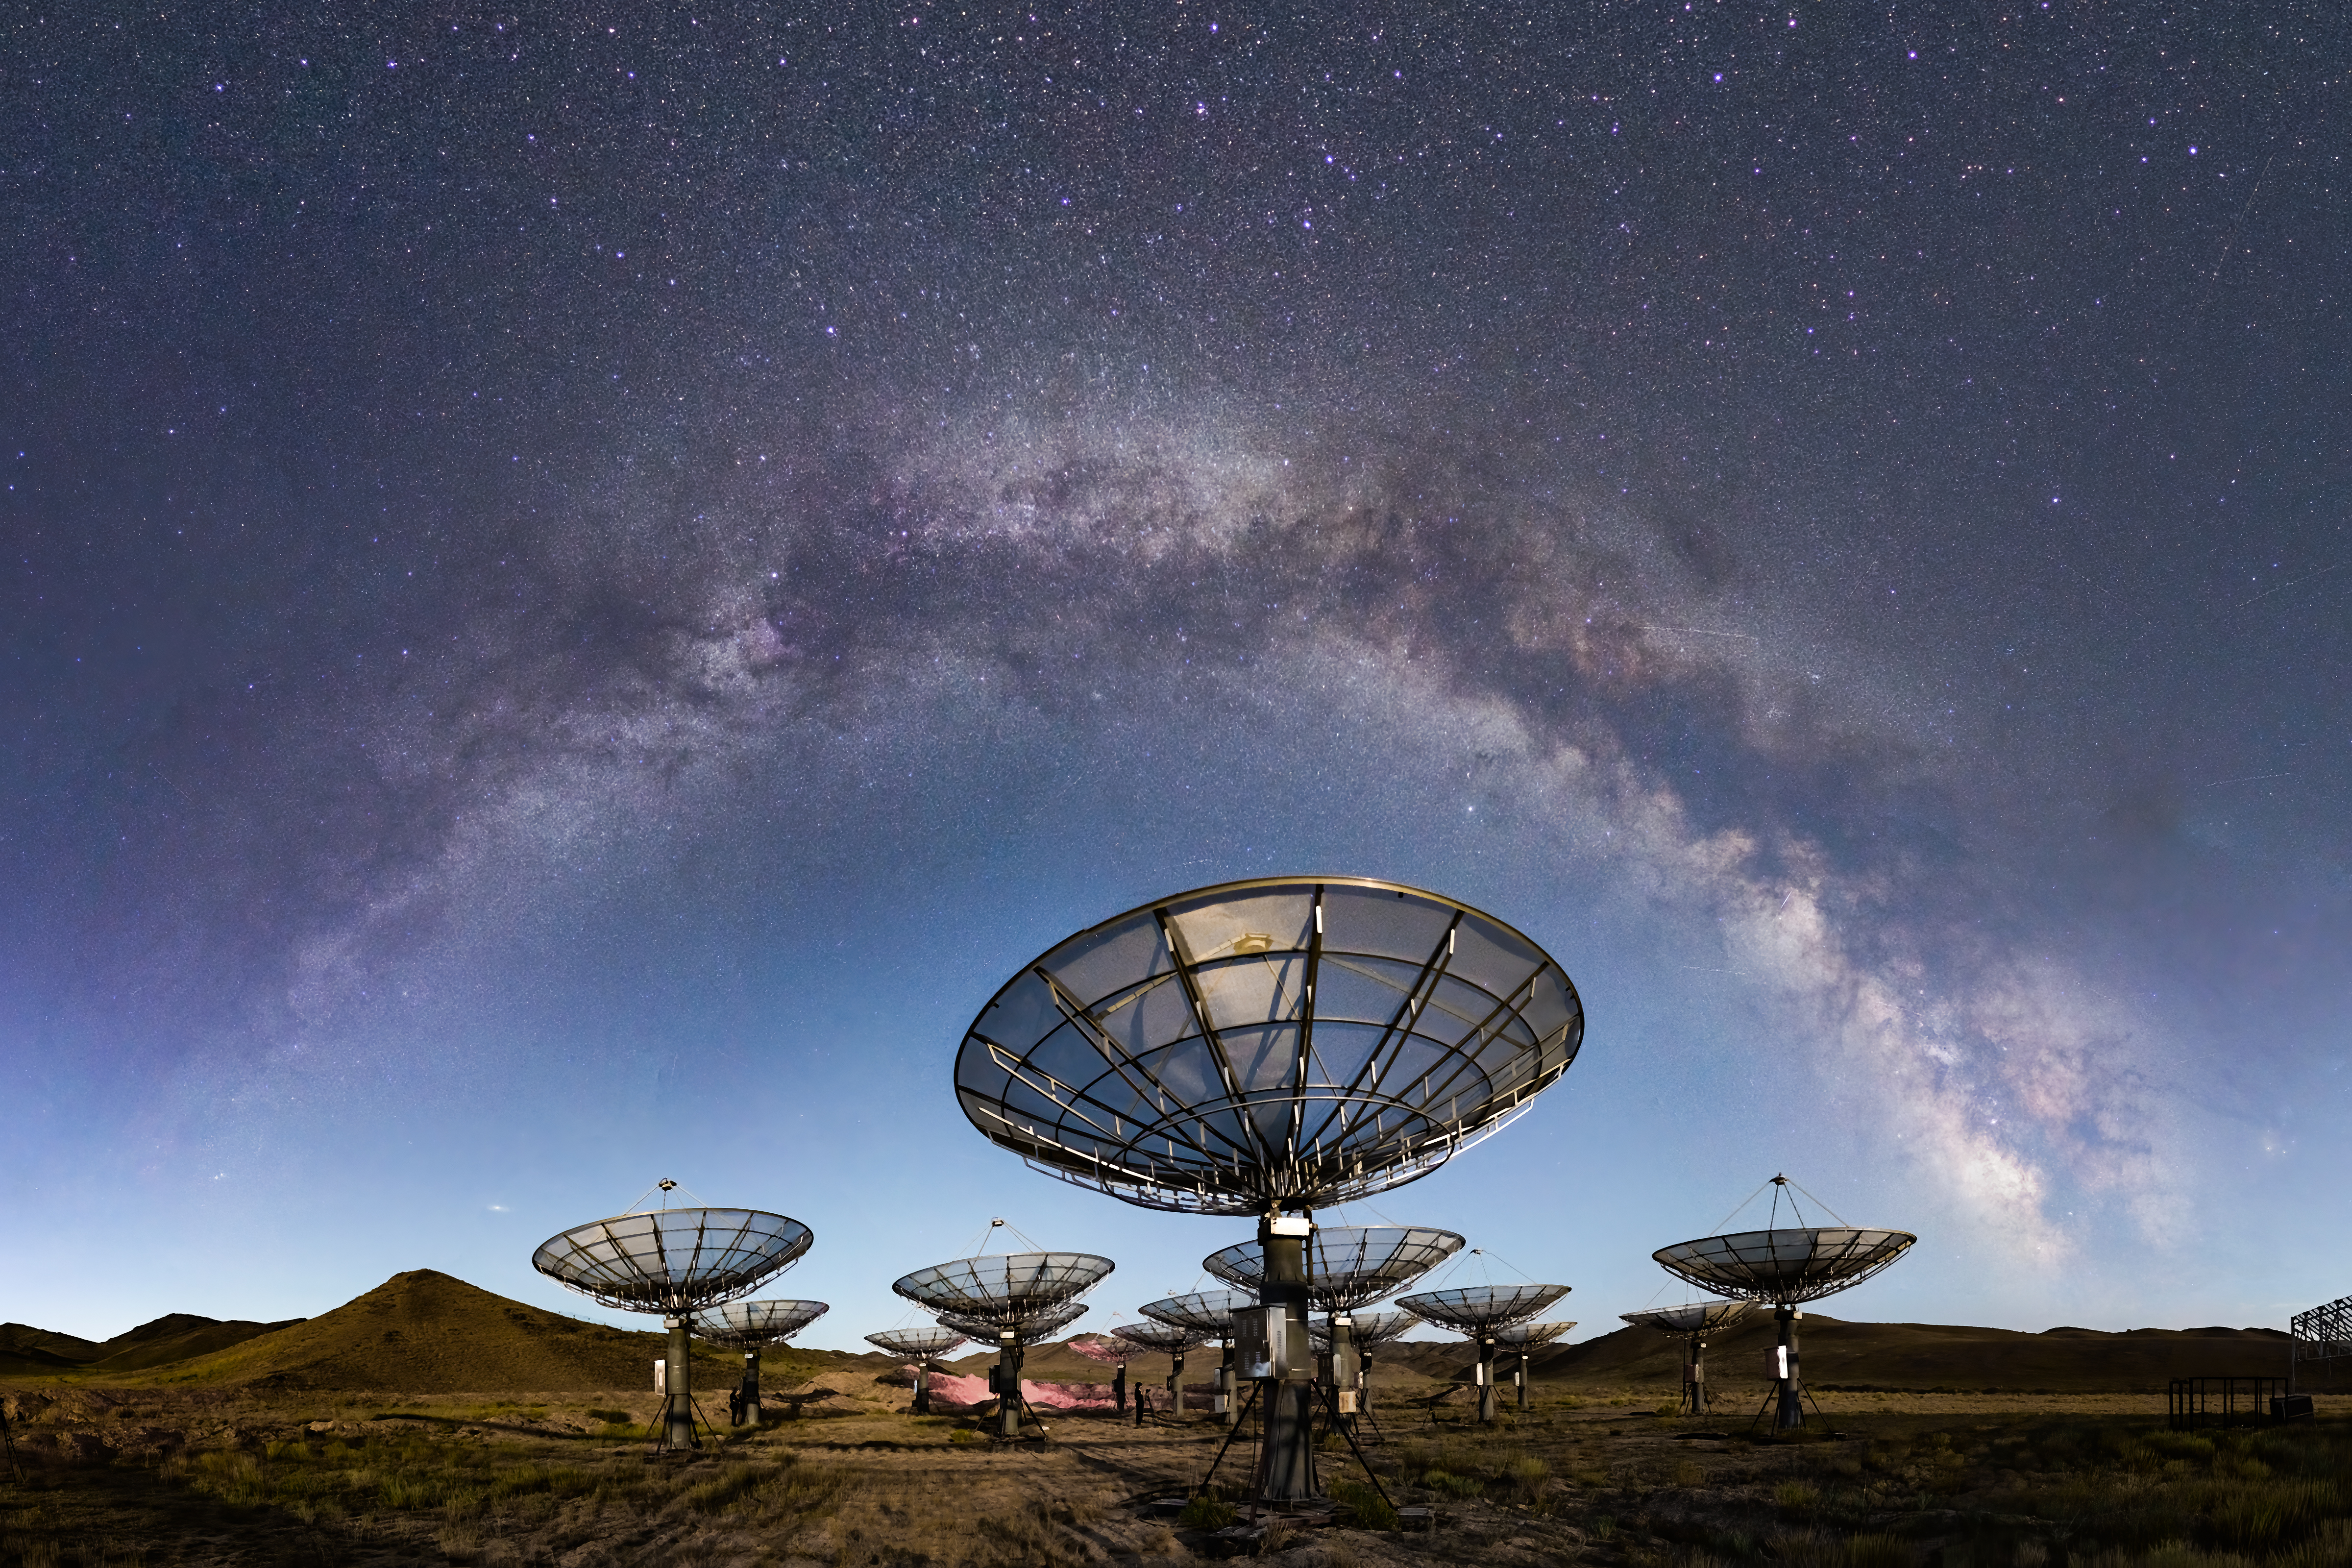
The Tianlai dish array, pictured here with the Milky Way overhead.
Cosmic Radio Static
An alternative method of mapping the Universe is presented by
using its most abundant element: hydrogen. Atomic hydrogen emits radio
waves, which luckily for us is easily observed on Earth and doesn't
require complicated methods of determining the position of a galaxy.
This technique is called 21cm Intensity Mapping, named after the
wavelength of light that hydrogen emits. We're still in the developmental
stages of this technique, which is where Tianlai comes in.
Tianlai's goal is to demonstrate the potential of this
technique to map the Universe, and prepare analytical pipelines and methodology
for future intensity mapping instruments.
I began my research career working with Peter Timbie,
on the Tianlai array.
To test this instrument, I built electromagnetic simulations
of the array in order to predict and characterize its response
to astronomical and test signals,
which was used during this instrument's calibration phase
(Zhang+21).
I then used observational data to quantify variations in the response
of the different dishes in the array
(Wu+21).

The hydrogen distribution within the cosmological simulation IllustrisTNG.
Although 21cm intensity mapping is a very promising method to map the Universe,
the technique is still in its developmental stages. To fully harness the capabilities
of future observations, we need to develop models that will allow us to infer the
full matter distribution from the hydrogen maps. Fortunately, these models already
exist, having been used in previous galaxy surveys! Ideally, we should be able
to just adopt those same models for hydrogen, right?
In Osinga+25, I tested these traditional models in a cosmological simulation (think
Universe in a box) called IllustrisTNG to get an idea of how well they perform. In a simulation,
we know the "true" matter distribution and the hydrogen distribution.
We can apply our models to the hydrogen distribution and compare the inferred matter distribution
to the true one in the simulation to assess the performance of these models.
In these tests, I found that
traditional models incur significant errors when applied to hydrogen.
This has two major ramifications. First, recent observations that employed
these models inferred biased values of various cosmological parameters. Second, there is a severe
need to improve these models to prepare for upcoming 21cm intensity mapping observations. In the
paper, I suggest some improvements that can mitigate some of these issues, but I plan on
examining these in more detail in future work.